分类 算法与数学基础 下的文章


https://github.com/risherlock/Magnetometer-Calibration


https://www.mirkosertic.de/blog/2023/01/magnetometer-calibration-ellipsoid/


How to calibrate a 2D magnetometer with ellipsoid fitting

Step 1: Load uncalibrated magnetometer data as CSV

The data was recorded by logging data from the magnetometer.

Take care! This calibration process should be done while all systems of your robot or solution are running, so in a real life environment. This will make sure we take all hard iron influences into consideration. Place the robot in the middle of a room and let your robot turn to the left and to the right for a minute, and record the data.

In[1]:

import mathimport pandas as pdimport numpy as npimport matplotlib.pyplot as pltfrom matplotlib.patches import Ellipserawdata = pd.read_csv('mag_out.csv')

Step 2: Visualize the data to see what is going on

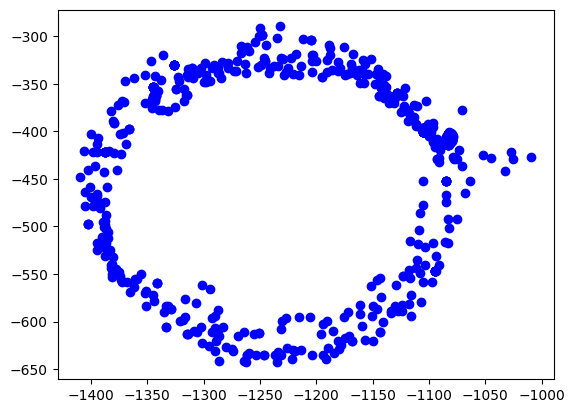
The easiest way is to plot the data on the x/y plane as a scatter plot. Every point represents a measurement of the magnetic field. We should see a perfect circle here, centered at (0,0).

Due due hard iron effects, we do not see a circle, but an ellipse. There are also outliers related to sensor noise. It also seems not to be centered at (0,0) at all.

Goal of the calibration procedure is to find a way to transform the measurements back into a circle.

In[2]:

plt.scatter(rawdata["x"], rawdata["y"], label='Data Points', color='b')plt.show()

Out[2]:

ellipsoid output 4 0

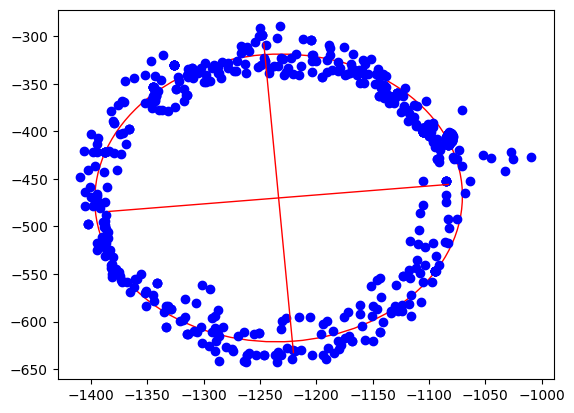
Step 3: Calculate the ellipsoid

Ellipsoid fitting tries to find the best fitting ellipsoid in the data. During this process, outliers are mostly eliminated and sensor noise reduced. As the result, we get the center point of the ellipsoid, the length of its axes and also its orientation.

In[3]:

xcol = rawdata["x"]ycol = rawdata["y"]xmin = xcol.min()xmax = xcol.max()ymin = ycol.min()ymax = ycol.max()width = xmax - xminheight = ymax - yminxyratio = width / height# Code taken from https://scipython.com/blog/direct-linear-least-squares-fitting-of-an-ellipse/def fit_ellipse(x, y):    """    Fit the coefficients a,b,c,d,e,f, representing an ellipse described by    the formula F(x,y) = ax^2 + bxy + cy^2 + dx + ey + f = 0 to the provided    arrays of data points x=[x1, x2, ..., xn] and y=[y1, y2, ..., yn].    Based on the algorithm of Halir and Flusser, "Numerically stable direct    least squares fitting of ellipses'.    """    D1 = np.vstack([x**2, x*y, y**2]).T    D2 = np.vstack([x, y, np.ones(len(x))]).T    S1 = D1.T @ D1    S2 = D1.T @ D2    S3 = D2.T @ D2    T = -np.linalg.inv(S3) @ S2.T    M = S1 + S2 @ T    C = np.array(((0, 0, 2), (0, -1, 0), (2, 0, 0)), dtype=float)    M = np.linalg.inv(C) @ M    eigval, eigvec = np.linalg.eig(M)    con = 4 * eigvec[0]* eigvec[2] - eigvec[1]**2    ak = eigvec[:, np.nonzero(con > 0)[0]]    return np.concatenate((ak, T @ ak)).ravel()def cart_to_pol(coeffs):    """    Convert the cartesian conic coefficients, (a, b, c, d, e, f), to the    ellipse parameters, where F(x, y) = ax^2 + bxy + cy^2 + dx + ey + f = 0.    The returned parameters are x0, y0, ap, bp, e, phi, where (x0, y0) is the    ellipse centre; (ap, bp) are the semi-major and semi-minor axes,    respectively; e is the eccentricity; and phi is the rotation of the semi-    major axis from the x-axis.    """    # We use the formulas from https://mathworld.wolfram.com/Ellipse.html    # which assumes a cartesian form ax^2 + 2bxy + cy^2 + 2dx + 2fy + g = 0.    # Therefore, rename and scale b, d and f appropriately.    a = coeffs[0]    b = coeffs[1] / 2    c = coeffs[2]    d = coeffs[3] / 2    f = coeffs[4] / 2    g = coeffs[5]    den = b**2 - a*c    if den > 0:        raise ValueError('coeffs do not represent an ellipse: b^2 - 4ac must'                         ' be negative!')    # The location of the ellipse centre.    x0, y0 = (c*d - b*f) / den, (a*f - b*d) / den    num = 2 * (a*f**2 + c*d**2 + g*b**2 - 2*b*d*f - a*c*g)    fac = np.sqrt((a - c)**2 + 4*b**2)    # The semi-major and semi-minor axis lengths (these are not sorted).    ap = np.sqrt(num / den / (fac - a - c))    bp = np.sqrt(num / den / (-fac - a - c))    # Sort the semi-major and semi-minor axis lengths but keep track of    # the original relative magnitudes of width and height.    width_gt_height = True    if ap < bp:        width_gt_height = False        ap, bp = bp, ap    # The eccentricity.    r = (bp/ap)**2    if r > 1:        r = 1/r    e = np.sqrt(1 - r)    # The angle of anticlockwise rotation of the major-axis from x-axis.    if b == 0:        phi = 0 if a < c else np.pi/2    else:        phi = np.arctan((2.*b) / (a - c)) / 2        if a > c:            phi += np.pi/2    if not width_gt_height:        # Ensure that phi is the angle to rotate to the semi-major axis.        phi += np.pi/2    phi = phi % np.pi    return x0, y0, ap, bp, e, phicoeffs = fit_ellipse(xcol, ycol)x0, y0, ap, bp, e, phi = cart_to_pol(coeffs)rat = ap / bp[rat, width, height, x0, y0, ap, bp, e, math.degrees(phi)]

Out[3]:

[1.0796413094280661,400.20000000000005,353.28000000000003,-1233.400221573585,-470.075066520626,163.20561364076153,151.16651448546256,0.3769501500025899,4.9892937074437285]

In[4]:

ellipse = Ellipse((x0, y0), ap * 2, bp * 2, color='r', angle=math.degrees(phi), fill=False)fig, ax = plt.subplots()ax.add_patch(ellipse)ax.scatter(xcol, ycol, label='Data Points', color='b')plt.plot([x0 - math.cos(phi) * bp, x0 + math.cos(phi) * bp], [y0  - math.sin(phi) * ap, y0 + math.sin(phi) * ap], color='r', linestyle='-', linewidth=1)plt.plot([x0 - math.cos(phi + math.pi / 2) * bp, x0 + math.cos(phi + math.pi / 2) * bp], [y0 - math.sin(phi + math.pi / 2) * ap, y0 + math.sin(phi + math.pi / 2) * ap], color='r', linestyle='-', linewidth=1)plt.show()

Out[4]:

ellipsoid output 7 0

Step 4: Apply offsets and rotation to data

We apply the found hard iron offsets, scale factors and rotation compensations to the data points to make it the best circle we can.

In[5]:

rot = round(phi / (math.pi / 2.0))rotation = -(phi - rot * math.pi / 2.0)def correctdata(row):    x = row["x"] - x0    y = row["y"] - y0    return [x * np.cos(rotation) - y * np.sin(rotation),            (x * np.sin(rotation) + y * np.cos(rotation)) * rat]res = rawdata.apply(correctdata, axis=1, result_type='expand')rawdata["xcorrected"] = res[0]rawdata["ycorrected"] = res[1]math.degrees(phi), math.degrees(rotation)

Out[5]:

(4.9892937074437285, -4.9892937074437285)

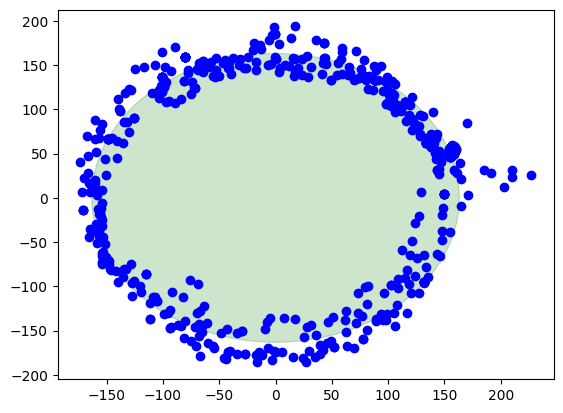
Finally, the corrected data

Here we are, this is the result when the calibration is applied. The center of the circle is at (0,0). There is also a green circle in the background showing the layout of a perfect circle to see the difference.

In[6]:

circle = plt.Circle((0, 0), ap, color='g', alpha=0.2)fig, ax = plt.subplots()ax.add_patch(circle)ax.scatter(rawdata["xcorrected"], rawdata["ycorrected"], label='Data Points', color='b')plt.show()

Out[6]:

ellipsoid output 11 0

Summary

Pros

  • Sensor noise and outliers are well handled

  • Directional and rotational offsets are corrected

  • Works with a small set of data points to start calibration

Cons

  • Computationally intensive

  • Harder math

  • Harder to debug


一、计算特征值与特征向量的方法

  • BDCSVD
  • JacobiSVD
  • SelfAdjointEigenSolver
  • ComplexEigenSolver
  • EigenSolver
  • GeneralizedSelfAdjointEigenSolver


二、方法说明

    2.1 BDCSVD
           功能为:Bidiagonal Divide and Conquer SVD,双对角线分治SVD


   2.2 JacobiSVD

            功能为:Two-sided Jacobi SVD decomposition of a rectangular matrix, 长方形矩阵的双侧 Jacobi SVD 分解。


    2.3 SelfAdjointEigenSolver

            功能为:Computes eigenvalues and eigenvectors of selfadjoint matrices. 计算自伴矩阵的特征值与特征矢量

    2.4 ComplexEigenSolver

             功能为:Computes eigenvalues and eigenvectors of general complex matrices. 计算一般复数矩阵的特征值与特征向量,这在特征值模块中定义。


     2.5 EigenSolver

            功能为:Computes eigenvalues and eigenvectors of general matrices. 计算一般矩阵的特征值与特征向量,这在特征值模块中定义。        
      

    2.6 GeneralizedSelfAdjointEigenSolver

           功能为:Computes eigenvalues and eigenvectors of the generalized selfadjoint eigen problem. 计算广义自伴特征问题的特征值与特征向量。


          我第一次接触数字磁强计是在2009年的夏天。当时,与许多Arduino 初学者一样,我更关心编写 I2C/SPI 驱动程序,而不是了解设备本身。几个月后,我买了一部 iPhone 4,并发现每次使用使用手机内部磁力计的指南针应用程序时都需要校准。因此,我开始感兴趣为什么需要这一步以及如何完成它。在这篇文章中,我将尝试通过一个实际的例子来解释一种实现方法。它本质上就是这里描述的方法,但有更多的细节和参考资料。

https://teslabs.com/articles/magnetometer-calibration/


A digital triple-axis magnetometer sold nowadays. Source: Sparkfun (CC-BY-NC-SA)


基本概念

          在开始之前,我们有必要明确几个概念。我们需要对地球磁场有一个基本的了解,这似乎是合乎逻辑的,因为这是我们想要测量的。此外,二次曲面(如球体或椭球面)的基础知识将变得很重要。 在这里讨论二次曲面可能有点尴尬,但很快就能理解。


地球磁场

           在地球上的任何位置,磁场都可以局部表示为一个恒定的三维矢量 ()。这个向量可以用三个性质来表征。首先,磁场强度或大小(),通常以纳特斯拉 (nT) 为单位,大约范围是 25000 nT 至 65000 nT。其次,磁倾角 (I),如果指向上方则为负值(最大 -90°),如果指向下方则为正值(最大 90°)。第三,磁偏角(D)测量磁场相对于地理北方的偏差,向东为正。


Magnetic field frame of reference. Source: Wikimedia Commons


利用上图中的参考系,地球磁场矢量h0可表示为:


给定一个地理点,可以使用 WMM 模型来获取 F、I 和 D 的预期值。为了计算罗盘上的地理北,磁偏角特别有用。


WMM 2015.0 intensity, inclination and declination maps. Source: NOAA/NGDC & CIRES


二次曲面

         二次曲面是所有能够用 x、y 和 z 的二次多项式表示的曲面。它们包括常见的表面,例如球体、椭圆体、抛物面等。二次曲面 S 的一般隐式方程由下式给出:


式(2)可以写成半矩阵形式,这对我们的问题特别有用:


磁力计测量

         首先,我们假设我们处于无磁干扰的环境中,并且我们有一个理想的 3 轴磁力计。在这些条件下,以任意方向获得的磁力计读数 h 将由以下公式给出:

通过这种方式查看磁力计样本,我们可以从几何角度看待这个问题。下面的交互式图表显示了一个计算示例。


失真源

        现实生活中没有什么是完美的,环境也不是没有干扰的。正如本出版物中详细介绍的那样,测量失真源主要有两类:仪器误差和磁干扰。在接下来的部分中,我们将简要介绍它们,最后介绍测量模型。


仪器错误

          仪器误差对于每台设备都是独一无二的,并且是恒定的。它们可以由三个部分建模而成。首先是比例因子,可以将其建模为对角矩阵:


磁场干扰


import sysimport numpy as npfrom scipy import linalgclass Magnetometer(object):    ''' Magnetometer class with calibration capabilities.        Parameters        ----------        sensor : str            Sensor to use.        bus : int            Bus where the sensor is attached.        F : float (optional)            Expected earth magnetic field intensity, default=1.    '''    # available sensors    _sensors = {'ak8975c': SensorAK8975C}    def __init__(self, sensor, bus, F=1.):        # sensor        if sensor not in self._sensors:            raise NotImplementedError('Sensor %s not available' % sensor)        self.sensor = self._sensors[sensor](bus)        # initialize values        self.F   = F        self.b   = np.zeros([3, 1])        self.A_1 = np.eye(3)    def read(self):        ''' Get a sample.            Returns            -------            s : list                The sample in uT, [x,y,z] (corrected if performed calibration).        '''        s = np.array(self.sensor.read()).reshape(3, 1)        s = np.dot(self.A_1, s - self.b)        return [s[0,0], s[1,0], s[2,0]]    def calibrate(self):        ''' Performs calibration. '''        print('Collecting samples (Ctrl-C to stop and perform calibration)')        try:            s = []            n = 0            while True:                s.append(self.sensor.read())                n += 1                sys.stdout.write('\rTotal: %d' % n)                sys.stdout.flush()        except KeyboardInterrupt:            pass        # ellipsoid fit        s = np.array(s).T        M, n, d = self.__ellipsoid_fit(s)        # calibration parameters        # note: some implementations of sqrtm return complex type, taking real        M_1 = linalg.inv(M)        self.b = -np.dot(M_1, n)        self.A_1 = np.real(self.F / np.sqrt(np.dot(n.T, np.dot(M_1, n)) - d) *                           linalg.sqrtm(M))    def __ellipsoid_fit(self, s):        ''' Estimate ellipsoid parameters from a set of points.            Parameters            ----------            s : array_like              The samples (M,N) where M=3 (x,y,z) and N=number of samples.            Returns            -------            M, n, d : array_like, array_like, float              The ellipsoid parameters M, n, d.            References            ----------            .. [1] Qingde Li; Griffiths, J.G., "Least squares ellipsoid specific               fitting," in Geometric Modeling and Processing, 2004.               Proceedings, vol., no., pp.335-340, 2004        '''        # D (samples)        D = np.array([s[0]**2., s[1]**2., s[2]**2.,                      2.*s[1]*s[2], 2.*s[0]*s[2], 2.*s[0]*s[1],                      2.*s[0], 2.*s[1], 2.*s[2], np.ones_like(s[0])])        # S, S_11, S_12, S_21, S_22 (eq. 11)        S = np.dot(D, D.T)        S_11 = S[:6,:6]        S_12 = S[:6,6:]        S_21 = S[6:,:6]        S_22 = S[6:,6:]        # C (Eq. 8, k=4)        C = np.array([[-1,  1,  1,  0,  0,  0],                      [ 1, -1,  1,  0,  0,  0],                      [ 1,  1, -1,  0,  0,  0],                      [ 0,  0,  0, -4,  0,  0],                      [ 0,  0,  0,  0, -4,  0],                      [ 0,  0,  0,  0,  0, -4]])        # v_1 (eq. 15, solution)        E = np.dot(linalg.inv(C),                   S_11 - np.dot(S_12, np.dot(linalg.inv(S_22), S_21)))        E_w, E_v = np.linalg.eig(E)        v_1 = E_v[:, np.argmax(E_w)]        if v_1[0] < 0: v_1 = -v_1        # v_2 (eq. 13, solution)        v_2 = np.dot(np.dot(-np.linalg.inv(S_22), S_21), v_1)        # quadric-form parameters        M = np.array([[v_1[0], v_1[3], v_1[4]],                      [v_1[3], v_1[1], v_1[5]],                      [v_1[4], v_1[5], v_1[2]]])        n = np.array([[v_2[0]],                      [v_2[1]],                      [v_2[2]]])        d = v_2[3]

return M, n, d


Example

To conclude this post we will use samples from a real magnetometer, which willallow us to see if the proposed solution behaves as expected. It is important tonote that we will not evaluate the accuracy of our solution, neither otherthings such as how the number of samples or their spatial distribution affectsthe calibration. These are topics that would require further study, out of thescope of this post.

The chosen magnetometer is the one found inside the InvensenseMPU-9150: AK8975C. It is a module thatalso contains an accelerometer and a gyroscope, not required for our purposes. ARaspberry Pi 2 will be used as a host platform, as shown below. This will allowus to quickly code a proof of concept by just using a few lines of Python. Notethat you will need to activate the I2C driver and install python-smbus on theRaspberry Pi (detailshere).


The proposed code for the AK8975C drive is:

import smbus# MPU9150 used registersMPU9150_ADDR                       = 0x68MPU9150_PWR_MGMT_1                 = 0x6BMPU9150_INT_PIN_CFG                = 0x37MPU9150_INT_PIN_CFG_I2C_BYPASS_EN  = 0x02# AK8975C used registersAK8975C_ADDR                       = 0x0CAK8975C_ST1                        = 0x02AK8975C_ST1_DRDY                   = 0x01AK8975C_HXL                        = 0x03AK8975C_CNTL                       = 0x0AAK8975C_CNTL_SINGLE                = 0x01# convert to s16 from two's complementto_s16 = lambda n: n - 0x10000 if n > 0x7FFF else nclass SensorAK8975C(object):    ''' AK8975C Simple Driver.        Parameters        ----------        bus : int            I2C bus number (e.g. 1).    '''    # sensor sensitivity (uT/LSB)    _sensitivity = 0.3    def __init__(self, bus):        self.bus = smbus.SMBus(bus)        # wake up and set bypass for AK8975C        self.bus.write_byte_data(MPU9150_ADDR, MPU9150_PWR_MGMT_1, 0)        self.bus.write_byte_data(MPU9150_ADDR, MPU9150_INT_PIN_CFG,                                 MPU9150_INT_PIN_CFG_I2C_BYPASS_EN)    def __del__(self):        self.bus.close()    def read(self):        ''' Get a sample.            Returns            -------            s : list                The sample in uT, [x, y, z].        '''        # request single shot        self.bus.write_byte_data(AK8975C_ADDR, AK8975C_CNTL,                                               AK8975C_CNTL_SINGLE)        # wait for data ready        r = self.bus.read_byte_data(AK8975C_ADDR, AK8975C_ST1)        while not (r & AK8975C_ST1_DRDY):            r = self.bus.read_byte_data(AK8975C_ADDR, AK8975C_ST1)        # read x, y, z        data = self.bus.read_i2c_block_data(AK8975C_ADDR, AK8975C_HXL, 6)        return [self._sensitivity * to_s16(data[0] | (data[1] << 8)),                self._sensitivity * to_s16(data[2] | (data[3] << 8)),                self._sensitivity * to_s16(data[4] | (data[5] << 8))]

Merging the sensor driver shown above with the code in the previous section willallow us to both sample and calibrate. We can also append the code shown below,which will allow us to store non-calibrated and calibrated samples to thenvisualize the results with any plotting library:

from time import sleepdef collect(fn, fs=10):    ''' Collect magnetometer samples        Parameters        ----------        fn : str            Output file.        fs : int (optional)            Approximate sampling frequency (Hz), default 10 Hz.    '''    print('Collecting [%s]. Ctrl-C to finish' % fn)    with open(fn, 'w') as f:        f.write('x,y,z\n')        try:            while True:                s = m.read()                f.write('%.1f,%.1f,%.1f\n' % (s[0], s[1], s[2]))                sleep(1./fs)        except KeyboardInterrupt: passm = Magnetometer('ak8975c', 1, 46.85)collect('ncal.csv')m.calibrate()

collect('cal.csv')


实际结果显示在以下交互式图表中:


Compass headings can be essential for many autonomous mobile robots, and magnetometers such as those included in the popular LSM303, MPU-6050, and BNo055 Inertial Measurement Units (IMUs) are commonly used for this task. Magnetometers are sometimes called a digital compass, but this is a bit misleading as there is more to it than that. This article aims to help you get the function of a digital compass out of a plain old magnetometer.


Magnetometers measure the Earth's magnetic field, allowing us to calculate a compass heading for our mobile robots or other applications based on these measurements. This article assumes you have the sensor data and just need to calculate headings with it. If you aren't quite there yet or want to learn more, my book, "Practical Robotics in C++," provides an in-depth guide to working with sensors, including sample programs. You can also find sensor and serial data tutorials at the Practical Robotics YouTube channel.


Products Mentioned in this article:

LSM303 Inertial Measurement Unit

MPU-6050 Inertial Measurement Unit

BNo055 Absolute Orientation Sensor

Disclaimer: Please note that the products linked on this page are not sponsored, but as an Amazon Associate I earn from qualifying purchases.


While the math to get a heading from raw magnetometer data is straightforward, there are some variations for many applications that makes it impossible to give a simple formula or chunk of code and send you on your way. Generally, though, these are the steps to calculate a heading:

  • Get magnetometer data for at least the X and Y axes

  • Maybe negate the Y value, maybe not

  • Use trig to calculate the direction of the magnetic field vector

  • Apply a correction to align with your coordinate convention

  • Compensate for magnetic declination

We'll talk about each of these steps in this article and add a couple more in the future to compensate for less than perfect conditions.


Some Background Info

The true north and south poles refer to the geographic points located at the top and bottom of the earth's rotational axis, respectively. These points mark the earth's axis of rotation and are used as a reference point for navigation and mapping purposes. On the other hand, the magnetic north and south poles are determined by the Earth's magnetic field, which is generated by the movement of molten iron in the planet's core. The magnetic north and south poles are not located at the same place as the true north and south poles. In fact, the Earth's magnetic north pole is currently located in northern Canada, while the magnetic south pole is located off the coast of Antarctica. Lastly, it's worth noting that what is commonly referred to as magnetic north is actually the location of the earth's magnetic south pole. This can be a bit confusing, but it's because the Earth's magnetic field lines emerge from the magnetic south pole and converge at the magnetic north pole. Figure 1 is my attempt at illustrating this stuff.


The earth's true and magnetic poles, earth's magnetic iron core orientation
Figure 1. The earth's true and magnetic poles.

Magnetometers measure the strength of the magnetic field, and we can determine the direction of the field if we measure in the X, Y, and Z axes at once (most magnetometers do this). For heading, we are concerned with the direction of the horizontal component of that direction, so we will start with using just the X and Y measurements. This works fine if the sensor is more or less level, but we will need to build on this method and include Z data later on to compensate for tilt. Figure 2 shows a magnetometer placed with its y-axis aligned with the Earth's magnetic field.


Visual representation of the Earth's magnetic field measured by a magnetometer, with flux lines passing through a sensor's x and y axes.
Figure 2. Visualizing the earth's magnetic field measured with a magnetometer.

The strength of the field on the x-axis is nearly zero because it is perpendicular to the field, and the strength of the field in the y-direction is either at its maximum or minimum (depending on whether it's facing North or South and how near or far you are from the poles). Whether the reading is positive or negative, we can say that the absolute value of the y measurement is at its maximum.


If the sensor is rotated so the x-axis is pointing north, the absolute value of x-axis measurement will increase to the same value and the absolute value of y-axis measurement will decrease until it reaches zero. If the wording above feels clunky or unclear, just takeaway three key things:

  • As it the sensor rotates, the strength of the field is always increasing on one axis and decreasing on the other.

  • The measurement will be essentially zero for an axis facing East or West. ("Essentially" because we must expect sensor noise and imperfections)

  • The measurement will be at its maximum absolute value for an axis that is facing North or South. The value will be equal but opposite facing the opposite direction.

Thanks to these predictable characteristics, we can easily use the trigonometry arctangent function to calculate the angle between the sensor's axes and the earth's magnetic field. Without further delay, lets dive into why you really came here and work the steps I listed above.


Get Magnetometer Data

As I mentioned earlier, getting data from your sensor is outside the scope of this article. The rest of this article assumes you have readings called X, Y, and Z. Your sensor might return values in either Tesla or Gauss, but because the calculations rely on the ratios and not the absolute values it does not matter which for our purposes. I will note that ROS convention is to use Tesla.


Maybe Negate the Y Value or Maybe Not

The direction of the earth's magnetic field can sometimes be significantly vertical and even cause a Y value to read negative when the sensor is pointed north (or tilted just little). The same sensor further south could read a positive value when pointed north. I have so far not found a definitive resource or map that indicates in a simple way where a person might need to negate that Y value, but I have found that Michigan, USA is far enough north and in a region where it is necessary. The best advice I have is to complete the calculations without negating Y, then do some tests. Heading values should increase when turning the sensor counter clockwise and decrease when turning clockwise. If this is not the case, try negating Y for the arctangent step below.


Arctangent: atan() vs atan2()

Most programming languages I've used have two arctangent functions we can use to calculate the angle between the x axis of the magnetometer and magnetic South. The first is atan(y/x), which only takes one argument (y/x is just a single value) and can only give a result in the first or fourth quadrant of the unit circle (from -pi/2 to pi/2). This requires extra code to determine the correct quadrant and heading so I suggest using atan2(y, x) as it uses y and x separately to calculate for all four quadrants, providing a result between -pi and pi. Quite simply, let's use:

magneticHeading = atan2(Y, X)//ormagneticHeading = atan2(-Y, X)

Note that the parameter order for atan2 is y before x every programming languag I've used it in (C++, Java, Matlab, and Python). Also don't forget that we use radians instead of degrees in robotics and trigonometry, but they can be easily converted using the formula degrees = radians * (180/pi) if needed.


Apply a correction to align with your coordinate convention

The result from the atan2() function is an angle between the magnetic field lines and the x axis of the magnetometer. However, to use this angle as a compass heading in a specific application, we need to adjust it to match the convention used by that application. For example, in ROS (Robot Operating System), the convention for compass headings is to use an angle between the positive y-axis and the direction of magnetic North. To convert the angle from atan2() to this convention, we need to add 90 degrees (or pi/2 radians) to the result.

magneticHeading += M_PI / 2 

Now we just need to ensure that the result stays within the bounds of -PI to +PI:

while (magneticHeading > M_PI)     magneticHeading -= 2 * M_PIwhile (magneticHeading <= -M_PI)     magneticHeading += 2 * M_PI

Compensate for magnetic declination

There is a difference between the magnetic axis of the Earth and it's axis of rotation. Maps typically adhere to rotational axis the truth, but our calculations so far are relative to the magnetic axis. The difference is measured as a declination angle, which varies in different parts of the world. In Detroit, Michigan the declination is about -8 degrees or -0.139 radians. We simply add this to our calculated magnetic heading to align with the Earth's rotational axis and thus, with most maps, GPS coordinates, etc.

declination = -0.139trueHeading = magneticHeading + declination

Declination varies a LOT just around the United States, so be sure to ask Google for the declination value for your location. It's probably in degrees so don't forget to convert it to radians.


Putting it all together: The C++, Python, and MATLAB code

All of my rambling on so far can be summarized with this formula:


heading = magnetic_field_direction + convention_offset + declination


Assuming you already have variables called X and Y populated with magnetometer data, the following code blocks put it together:


C++

#include <iostream>#include <cmath>//radians. Location specific.double declination = -0.139;// adjustment needed for ROS conventiondouble convention_offset = -1.57;// calculate magnetic field directiondouble magnetic_field_direction = atan2(-Y, X);// calculate true headingdouble trueHeading = magnetic_field_direction + convention_offset + declination;// ensure result is in bounds of -PI to +PIwhile (trueHeading < -M_PI)     trueHeading += 2.0 * M_PI;while (trueHeading > M_PI)    trueHeading -= 2.0 * M_PI;

Python

import math# radians. Location specific.declination = -0.139# adjustment needed for ROS conventionconvention_offset = -1.57# calculate magnetic field direction. Negate Y if necessarymagnetic_field_direction = math.atan2(Y, X)# calculate true headingtrueHeading = magnetic_field_direction + convention_offset + declination# ensure result is in bounds of -PI to +PItrueHeading = (trueHeading + math.pi) % (2*math.pi) - math.pi


MATLAB

% radians. Location specific.declination       = -0.139% adjustment needed for ROS conventionconvention_offset = -1.57% calculate magnetic field direction. Negate Y if necessarymagnetic_field_direction = atan2(Y, X)% calculate true headingtrueHeading = magnetic_field_direction + convention_offset + declination% ensure result is in bounds of -PI to +PItrueHeading = wrapToPi(trueHeading);

Why are my headings incorrect?

Compass headings can be calculated using magnetometer data, but it is important to note that the data may be distorted by nearby magnets or iron objects, as well as the sensor itself. If the disturbance is fixed in relation to the sensor (like parts of the robot itself), calibration can be used to measure and cancel out the effect. I will show you how to easily do this in my very next article, again in C++, Python, and MATLAB.


It is also important to know that the result is only reliable if the sensor is relatively flat. Compensating for tilt will be the topic of the final article in this series.


Peace out

I hope you found this article helpful in calculating compass headings using magnetometers. Remember, while the math may seem straightforward, there are variations and nuances to consider based on your application. Don't hesitate to seek additional resources such as our book "Practical Robotics in C++" and tutorials on the Practical Robotics YouTube channel. Thanks for reading and keep exploring and experimenting to optimize your robot's navigation!